


As a website owner, you're constantly striving to improve your website's user experience and drive more conversions. But with so many metrics to track and analytics tools to choose from, it can be overwhelming to know where to start. That's where Microsoft Clarity comes in.
Microsoft Clarity is a powerful website analytics tool that provides valuable insights into user behavior and website performance. The best part? It's completely free to use. By using Microsoft Clarity, website owners can gain access to features such as heatmaps, clickmaps, and session replays, which allow them to see how users are interacting with their website. With this information, website owners can identify areas for improvement, enhance user experience, and prevent potential issues. Whether you're a business owner, marketer, or web developer, Microsoft Clarity is a must-have tool in your arsenal.
The Basics of Microsoft Clarity
Before we dive into the benefits of using Microsoft Clarity, let's take a quick look at how the tool works. Microsoft Clarity is a web analytics tool that uses a combination of session replay, heatmaps, and funnels to help website owners understand how users interact with their website.
Here are some of the key features of Microsoft Clarity:
- Session replay: This feature allows you to watch recordings of user sessions on your website, so you can see exactly how users are interacting with your website.
- Heatmaps: Heatmaps show you where users are clicking and scrolling on your website, so you can identify the areas of your website that are most engaging to users.
- Funnels: Funnels track user journeys through your website, so you can see where users are dropping off and identify areas for improvement.
- Insights dashboard: The insights dashboard provides an overview of key website metrics, such as bounce rate, time on site, and conversion rate.
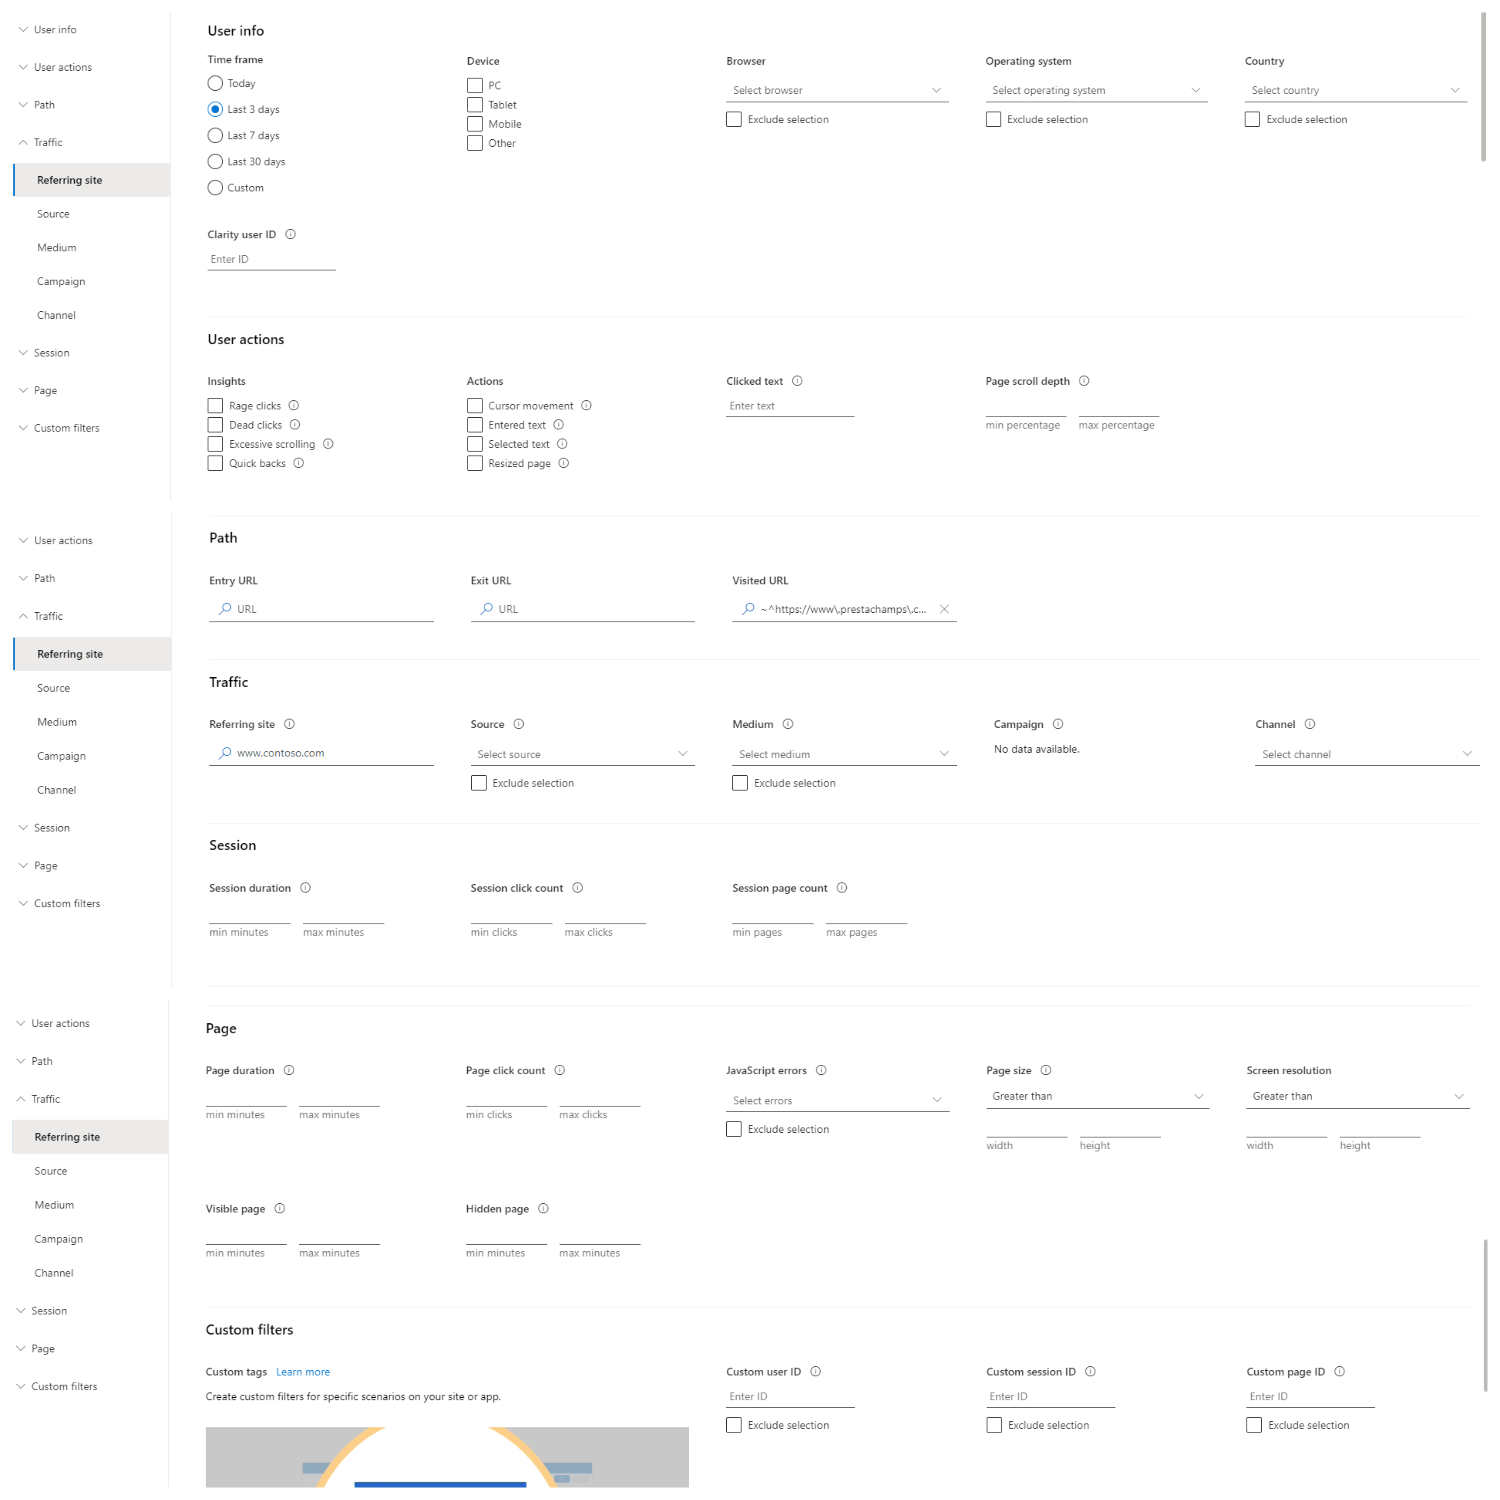
- Filters: Filters allow you to segment your data and analyze specific subsets of user behaviour, such as traffic from a particular geographic region or device type.
- Goals: You can set goals within Microsoft Clarity, such as a specific conversion rate or time on site, and track progress towards those goals over time.
- Feedback: Microsoft Clarity also allows you to collect user feedback, so you can gain insights into user preferences.

Using Microsoft Clarity to Improve User Experience
Microsoft Clarity provides a range of standard metrics and tables that you would expect from any web analysis solution. These metrics can provide valuable insights into how users are interacting with your website, which pages are most popular, and where improvements can be made. Here are some of the standard metrics and tables available within Microsoft Clarity:
- Sessions: This metric tracks the number of times users visit your website.
- Pages per session: This metric measures the average number of pages that users view during a single session on your website. This can help you understand how engaged users are with your content and whether they are finding what they are looking for.
- Scroll depth: This metric measures how far users are scrolling down a page on your website. By analyzing scroll depth, you can identify which sections of your website are the most engaging and which may need improvement.
- Popular pages: This table shows which pages on your website are the most visited. By analyzing popular pages, you can identify which content is resonating with users and which may need to be updated or expanded.
- Referrers: This table shows where users are coming from before visiting your website. By analyzing referrers, you can identify which sources are driving the most traffic to your website and optimize your marketing efforts accordingly.
- Breakdown by device: This table shows which devices users are using to access your website, such as desktop, mobile, or tablet. By analyzing device breakdowns, you can identify which devices are most popular among your users and optimize your website for those devices.
- Breakdown by operating system: This table shows which operating systems users are using to access your website, such as Windows, iOS, or Android. By analyzing operating system breakdowns, you can identify which systems are most popular among your users and optimize your website for those systems.
- Breakdown by browser: This table shows which browsers users are using to access your website, such as Chrome, Firefox, or Safari. By analyzing browser breakdowns, you can identify which browsers are most popular among your users and optimize your website for those browsers.
- Breakdown by country: This table shows which countries users are visiting your website from. By analyzing country breakdowns, you can identify which regions are most popular among your users and optimize your website for those regions.
Analyzing User Behavior with Microsoft Clarity
Microsoft Clarity's user behaviour analytics goes beyond just the standard metrics and offers unique insights into how users are interacting with your website. Here are some of the user behaviour-oriented metrics that Clarity provides:
- Dead clicks: Dead clicks are a metric that shows when a user clicks on a page, but nothing happens. These types of clicks can indicate issues with website design or functionality, such as broken links or non-clickable elements.
- Rage clicks: Rage clicks are a metric that tracks when a user rapidly clicks the same small area, indicating frustration or confusion with a particular element on the page.
- Excessive scrolling: Excessive scrolling is a metric that tracks how much a user scrolls through a page. If a user scrolls excessively, it may indicate that they are having difficulty finding the information they need on the page.
- Quick backs: Quick backs are a metric that tracks when a user navigates to a page and quickly returns to the previous one. This may indicate that the user did not find what they were looking for on the page.
- JavaScript errors: JavaScript errors are a metric that tracks the percentage of sessions that have JavaScript errors. These types of errors can cause issues with website functionality and can affect the user experience. Tracking JavaScript errors can help you identify and fix any issues with your website's code.
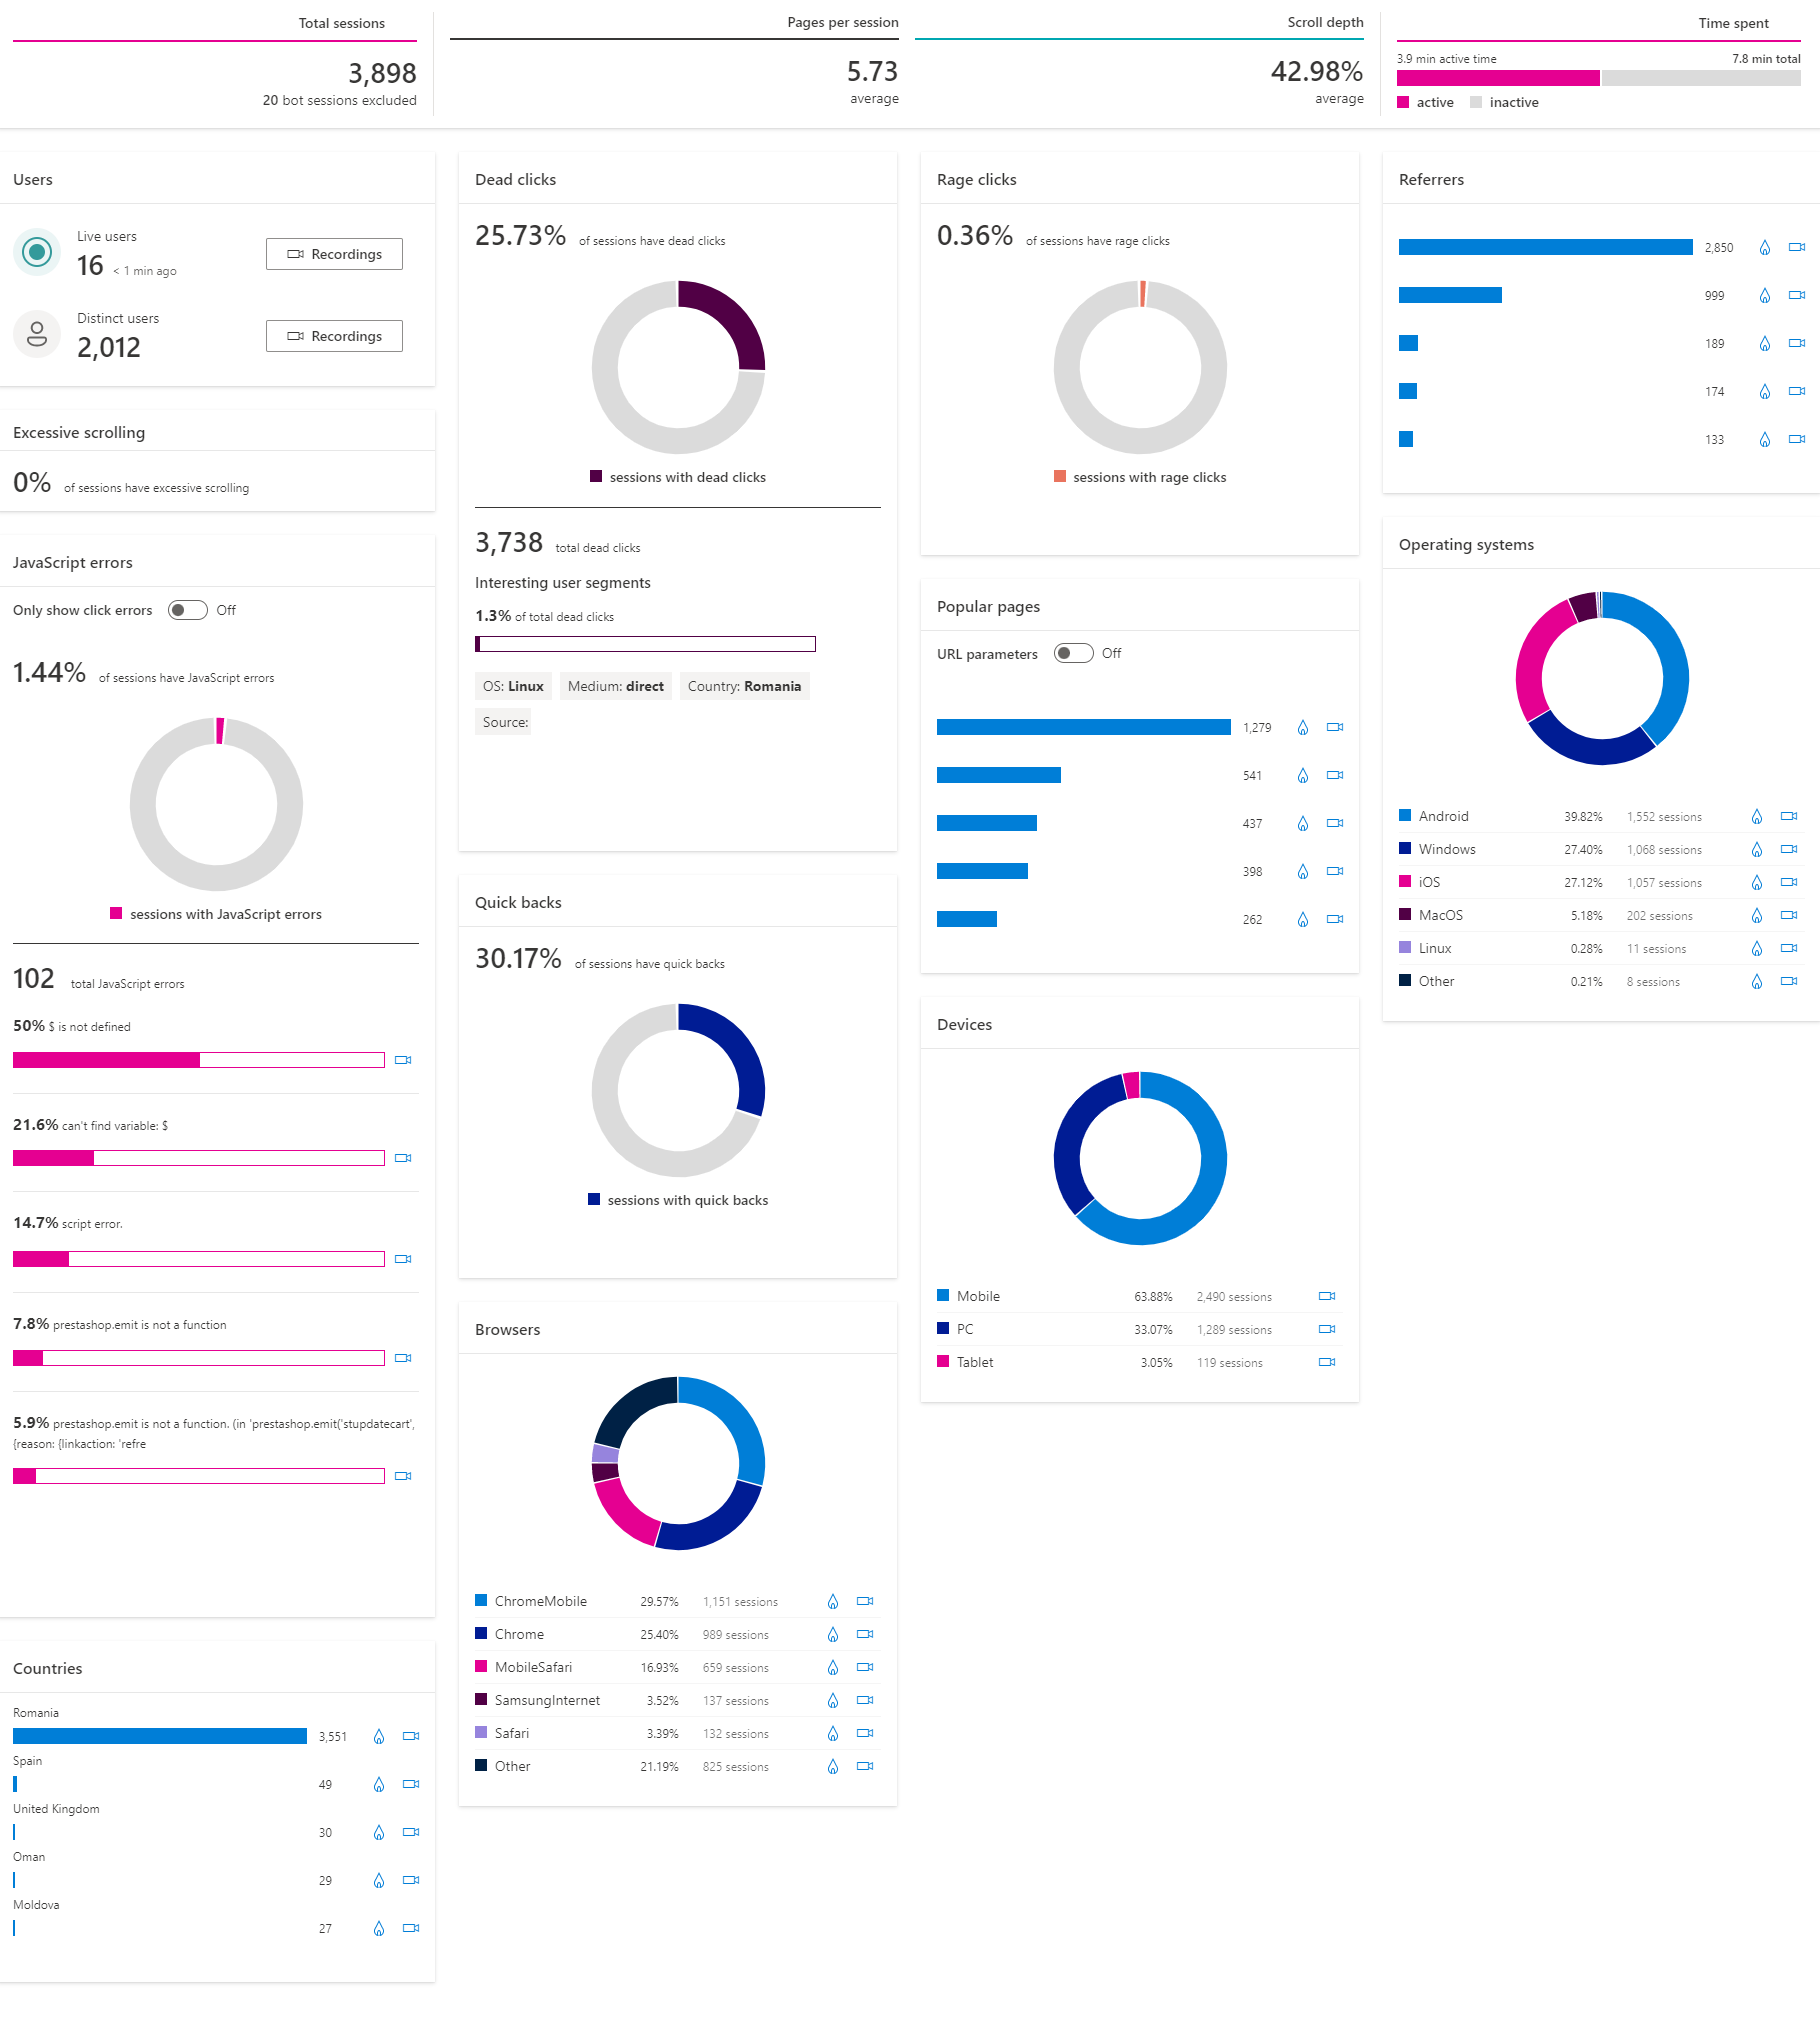
By tracking these unique user behaviour-oriented metrics, Microsoft Clarity provides valuable insights into how users are interacting with your website. These insights can help you identify issues with website design, usability, and content and make data-driven decisions to improve the user experience.
Best Practices for Using Microsoft Clarity
To get the most out of Microsoft Clarity, it's important to follow best practices and use the tool in conjunction with other analytics tools. Here are some tips to help you get started:
- Set clear goals and objectives for your website, and use Microsoft Clarity to track progress towards those goals.
- Analyze data regularly and use it to make informed decisions about website optimization.
- Use Microsoft Clarity in conjunction with other analytics tools, such as Google Analytics, to get a more comprehensive view of your website's performance.
- Don't rely solely on anecdotal evidence or gut feelings when making changes to your website. Use data to inform your decisions.
If you're interested in optimizing your website with Microsoft Clarity, contact us today to learn more about our services. Our team of experienced web developers and UX designers can help you install and configure Microsoft Clarity on your website and provide ongoing support and guidance.